Tumbling is general
This project is maintained by Julia Lazzari-Dean in the York lab, and was funded by Calico Life Sciences LLC
Appendix
From cameras to confocal to cytometry: measuring tumbling rates is a general way to reveal protein binding
*Permanent email: julia.lazzaridean+tumbling@gmail.com
†Permanent email: maria.del.mar.ingaramo+tumbling@gmail.com
‡Permanent email: andrew.g.york+tumbling@gmail.com
Pre-print published: October 20, 2023
Please cite as: Julia R. Lazzari-Dean, Austin E.Y.T. Lefebvre, Rebecca Frank Hayward, Lachlan Whitehead, Maria Ingaramo, Andrew G. York. From cameras to confocal to cytometry: measuring tumbling rates is a general way to reveal protein binding. (2023) DOI: 10.5281/zenodo.10028432
This appendix contains:
- Tumbling versus other approaches to measuring interaction in situ
- Relationship between tumbling time and particle size
- Expected tumbling times in the cell
- Quantifying alignment of a population of molecules
- Intensity versus fluence
- Usage examples for the tumbling simulation code
- Experimental factors that reduce measured polarization
- Detector requirements for triggered triplets
- Comparison of rsFPs and triggered triplets
- Triggerable state lifetimes in FPs
- Nanosecond-scale dynamics of prompt and triggered FP fluorescence
- Increasing alignment with 'crescent' selection
Back to the main text
Raw Data
The raw data used to generate the main text figures is available at doi.org/10.5281/zenodo.10028240.
Materials and Methods
Fluorescent Protein Purification
The fluorescent proteins (FPs) mScarlet and mVenus were purified from E. coli T7 express (New England BioLabs) using the pRSET expression vector (Thermo Fisher Scientific) as described below. Purified mEGFP was purchased from WuXi. Full construct sequences are available here.
Chemically competent E. coli T7 express cells (made in-house) were transformed with pRSET-mScarlet or pRSET-mVenus. 24 hours later, overnight cultures (≈14 hours) were started at 30°C in LB containing 100 μg/mL carbenicillin. These overnights were diluted 1:100 the next morning into fresh LB-carbenicillin (0.5-2 L scale) and grown until OD 0.4-0.6. At OD 0.4-0.6, cultures were induced with 200 μM IPTG and allowed to express overnight.
E. coli expressing the FP were then pelleted at 4°C (6,000xg, 30 minutes) and washed once with 1x PBS. For convenience, pellets were sometimes frozen at -80°C after this step and then subsequently thawed on ice before proceeding. The cells were resuspended in lysis buffer (300 mM NaCl, 50 mM sodium phosphate, pH 8) containing 1x BugBuster Protein Extraction Reagent (EMD Millipore Corp.) at a volume of approximately 10x the pellet volume. Lysing cells were incubated at room temperature for 30 minutes with gentle mixing. Following lysis, insoluble components were pelleted (12,000xg, 20 minutes, 4°C) and the FP-containing supernatant was decanted. A 1:1000 dilution of polyethylenimine (PEI) was added to the supernatant to precipitate nucleic acids, and the samples were spun again at 12,000xg for 20 minutes at 4°C.
This supernatant was then added to washed Ni-NTA resin (Qiagen cOmplete His-Tag Purification Resin) in lysis buffer and incubated for 30 minutes at room temperature with gentle mixing. The FP-bound beads were washed three times with lysis buffer, where each wash consisted of a 10 minute room temperature incubation, a 15 minute spin at 1000 RPM (211xg), removal of the supernatant, and addition of fresh lysis buffer.
FPs were eluted in lysis buffer supplemented with 500 mM imidazole and transferred to a spin concentrator. After the total volume was reduced to less than 5 mL, proteins were buffer exchanged into PBS (Corning, pH 7.4, 9 g/L NaCl, 0.144 g/L KH2PO4, 0.795 g/L Na2HPO4) with a PD-10 desalting column (Millipore Sigma). Protein concentration was estimated on a NanoDrop 2000C spectrophotometer (Thermo Fisher Scientific) from the published extinction coefficient at the absorption maximum (mVenus: ε=104,000 at 515 nm; mScarlet ε=100,000 at 569 nm [Bindels 2017, Kremers 2006]). Proteins in PBS were kept at 4°C for short-term storage and -80°C for long-term storage.
Imaging Settings
General
We collected fluorescence data with an SP8 point scanning confocal microscope (Leica) equipped with an LSM FLIM/FCS upgrade kit for time-correlated single photon counting (TCSPC, PicoQuant GmbH). Visible (488 or 561 nm) excitation was provided with the system’s white light laser, and 775 nm excitation was provided by the STED laser. A repetition rate of 80 MHz was used. We removed the quarter-wave plate from the beampath to enable polarization measurements, giving us orthogonally linearly polarized visible and 775 nm beams. Because we were repurposing the STED line with the λ/4 plate removed, we anticipate that the point-spread function of the 775 nm spot is substantially larger than the 488 nm spot and non-optimally shaped. The image was raster scanned with a resonant galvo at 8 kHz.
Fluorescence emission was collected through a 100x/1.4 NA oil immersion objective (HC PL APO CS2, Leica) and passed through notch filters blocking 488/561/633 and 775 nm laser lines in the primary and secondary dichroic positions. Emitted light passed through a polarizing beam splitter at the back (X1) port to two fiber-coupled SPAD detectors (PicoQuant). Bandpass emission filters (Semrock, mVenus: 531/40 nm; mScarlet 630/92 nm) were placed in front of each SPAD to block any remaining excitation light. Photon timing was performed with a PicoHarp 300 TCSPC module (PicoQuant).
The confocal pinhole was set to 1 AU, and data was collected from a focal plane ≈2 μm above the coverglass. This plane was selected to minimize spherical aberrations and scattering from the bead sample and to eliminate signal from any beads or protein adsorbed to the coverglass.
Because our pulse schemes were typically not supported by the software, we used a custom parser of the raw time-tagged photon stream to parse the data. This parser code is available with the source data or on GitHub.
Time-Resolved Fluorescence Anisotropy
The correction for optical transmission of the two polarization channels ("\(G\) factor") was measured daily with a solution of either 10 μM fluorescein in 0.1 M NaOH or 2 μM sulforhodamine 101 in PBS. \(G\) was determined as the correction factor that resulted in equal signal in the two detector channels after any initial rapid relaxation in these dye samples (> 1 ns into the recording); it ranged from 0.89 - 0.91 for these experiments. We incorporate \(G\) into the polarization calculation for all experimental data.
To record the fluorescence anisotropy of the bead samples from the prompt singlets, we used a 15 second integration time over a 5.8 μm x 5.8 μm area. Typical power (488 or 561 nm) for fluorescence anisotropy recordings was approximately 0.3 μW measured at the sample.
Triplet Triggering
To achieve microsecond control over the laser pulse sequence, we programmed successive line sweeps of the resonant scanner to have different lasers active (or no laser to produce a delay). With an image size of 5.81 μm x 609.71 nm (144x16 pixels) and a zoom factor of 20, this approach allowed us to access each point in the image at 60 μs intervals. (This ‘hack’ was necessary because the instrument hardware did not give us direct access to arbitrary programming of the lasers’ AOTFs.) We set up either 8 or 16 sweeps, with the white light laser (pump) active on the first sweep. One of the subsequent sweeps contained the 775 nm probe pulse, and the other sweeps involved no laser illumination. For the ‘crescent’ selection, we also included 775 nm excitation during the first sweep with the white light laser with a 2 ns delay after every visible light pulse.
Average pump power (visible, 488 or 561 nm) was approximately 5 μW at the sample, and average probe power was approximately 400 μW. Both pump and probe lasers were pulsed at 80 MHz with a 200 ns pixel dwell time for a total of 16 pulses in each position. The crescent selection power for the tumbling traces in Figure 6 was 100 μW for mVenus and 400 μW for mScarlet.
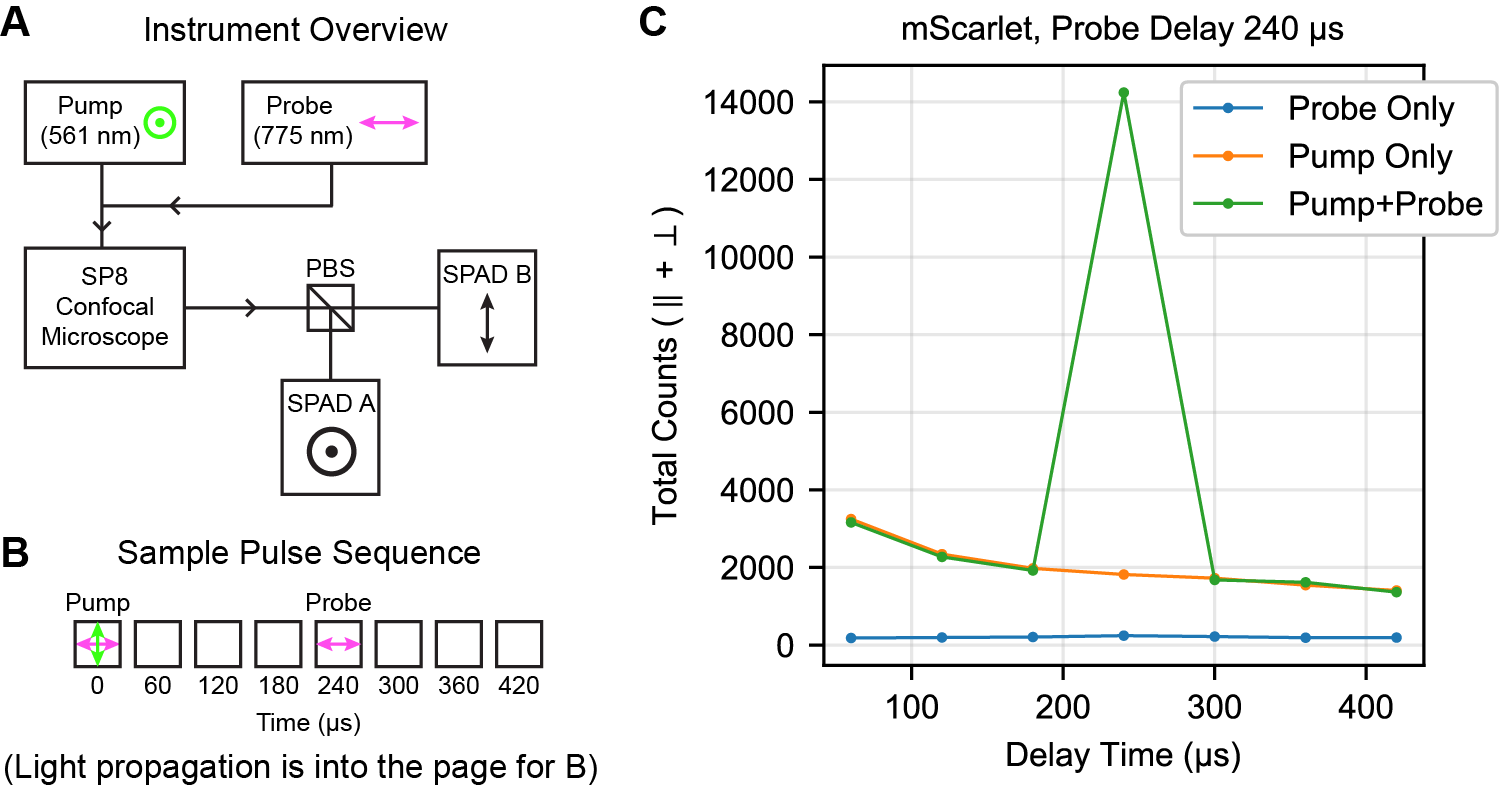
We summed this triggered triplet signal across all pixels of this image for 1000 frames to obtain the triggered triplet signal. For most analysis, we also summed the fluorescence lifetime information from each trigger pulse, resulting in a single value for each detector at a given delay. Figure S1 shows representative traces obtained with this pulse scheme.
| Fluorescent Protein: |
(A) Overview of instrumentation used to collect pump-probe tumbling recordings. PBS: polarizing beam splitter. (B) Sample pulse sequence with a probe delay of 240 μs, as well as the use of the 775 nm ‘crescent’ selection to narrow the initial distribution of fluorophores during the pump pulse. (C) Representative single-trial recordings of triplet triggering. No signal is generated by the probe laser only, and the pump laser generates a decaying background on the SPAD. The combination of the pump laser followed by the probe laser as shown in (B) generates a triggered fluorescence signal. mScarlet and mVenus were adsorbed to 40 nm beads for this measurement; EGFP was in PBS at 5 μM.
We noticed a time-decaying background on the SPADs following the initial sweep (Figure S1C). We determined this background from the signal at that delay time without the 775 nm trigger pulse. This background signal was subtracted from the triplet signal. We also confirmed that the 775 nm pulse did not directly excite the FP ground state; in other words, there is no triggered signal unless the sample was first illuminated with the pump pulse.
Adsorption of Fluorescent Protein to Beads
To accurately assess triggered triplet tumbling, we needed a series of fluorescent objects of known sizes. To this end, we chose to work with known diameter beads with fluorescent protein adsorbed to the surface. When optimizing the sample preparation, we wanted to (1) rigidly affix the fluorescent protein to the bead, (2) avoid homo-FRET among the FPs on the surface, (3) ensure no free protein remained in the sample, and (4) confirm that the bead samples had not aggregated, thus changing their size. We verified (1-3) by analyzing the conventional time-resolved fluorescence anisotropy signal, and we addressed (4) with dynamic light scattering (DLS) and observation on a confocal microscope. These quality control techniques are discussed further below.
Carboxyl-modified latex (CML) beads at 4% solids were purchased from Thermo Fisher Scientific in four diameters (40 nm, 60 nm, 100 nm, and 200 nm). Purified protein was passively adsorbed to the bead surface by mixing and 10 minute incubation. Following adsorption, we found that the adsorbed protein-bead mixture was stable for about an hour at room temperature, with aggregation increasing somewhat after that. Adsorption to the bead appeared irreversible in our hands, with multi-day dialysis not eliminating bead fluorescence (data not shown).
A key parameter to avoid both homo-FRET and free protein is the total amount of protein added to the bead mixture. For simplicity, we avoided washing and instead reduced the label level such that the vast majority of FP was adsorbed. Final protein labeling concentrations were selected to minimize the loss of anisotropy during the 12.5 ns observation window, while retaining sufficient triggered triplet signal. An ideal bead sample would only lose anisotropy from tumbling of the entire bead, which occurs on timescales longer than 12.5 ns. Figure S2 shows anisotropy traces for the conditions used for tumbling experiments. Complete immobilization without any homo-FRET and perfectly aligned absorption and emission dipoles would produce a horizontal line at polarization 0.5 for all samples. Calculated final binding densities depended on the combination of the bead and the protein and ranged from 1 protein per 250 nm2 to 1 protein per 750 nm2 of bead surface area.
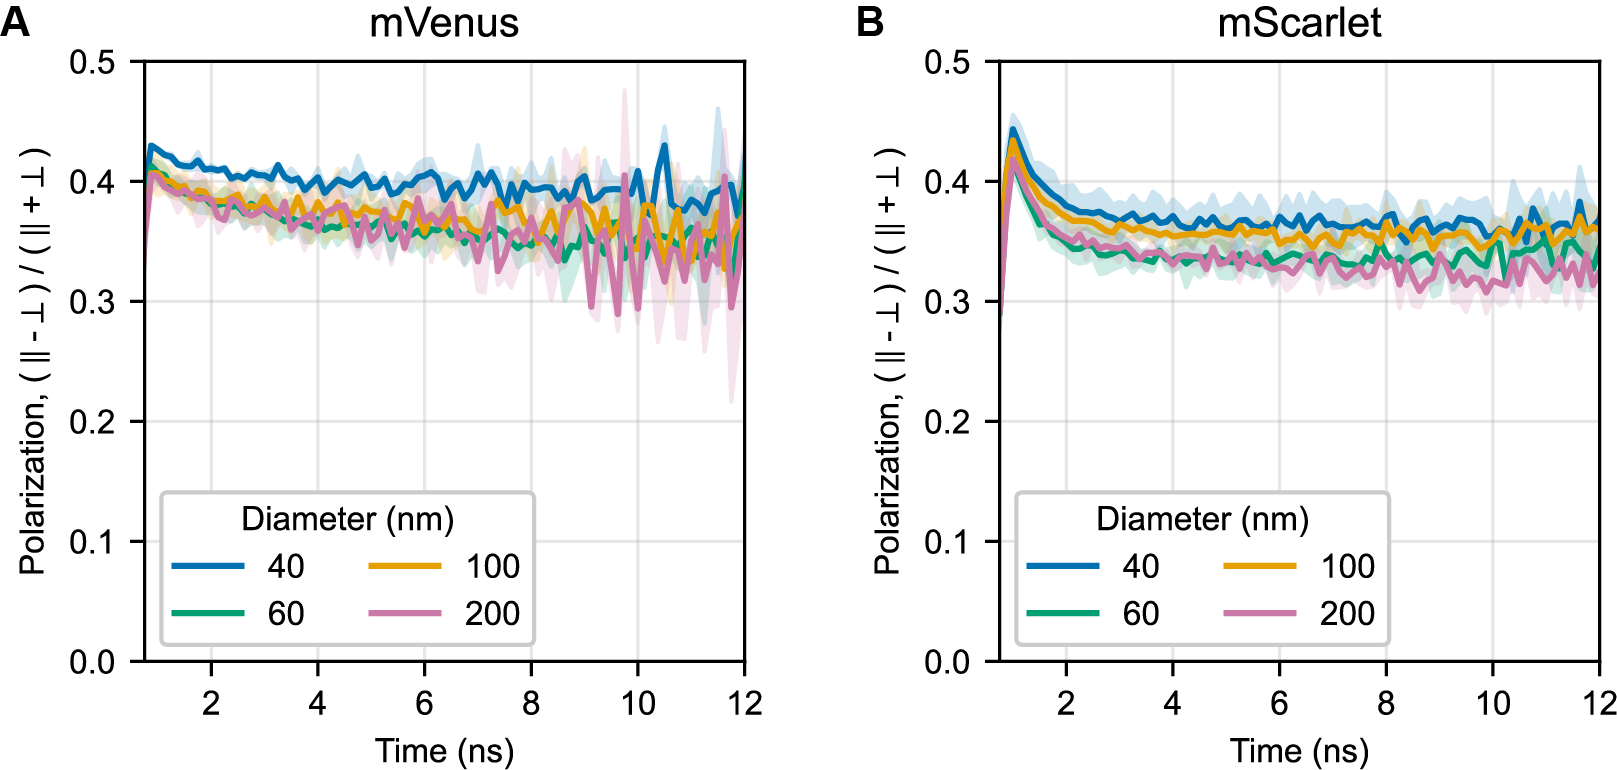
Traces show the mean of 2-3 recordings for each bead size for (A) mVenus and (B) mScarlet; shaded areas indicate standard deviation. Reduction of the starting polarization below the theoretical maximum of 0.5 is most likely attributable to the high collection NA.
We performed a scan of buffers and pH to identify optimal binding conditions, settling on 50 mM MES pH 6.3. To reduce aggregation, 0.025-0.05% Tween was added to each sample. Recipes for the bead solutions are listed in Table S1 below. Samples were mixed and imaged in 384 well glass-bottom plates (Cellvis LLC). Where relevant, stock solutions were diluted to avoid pipetting volumes smaller than 0.5 μL.
| Ingredient | 40 nm bead | 60 nm bead | 100 nm bead | 200 nm bead |
|---|---|---|---|---|
| 0.1 M MES pH 6.3 | 10 | 10 | 10 | 10 |
| 100 μM protein stock in PBS | 4.44 (mVenus), 2.96 (mScarlet) | 2.91 (mVenus), 0.97 (mScarlet) | 1.51 (mVenus), 1.01 (mScarlet) | 0.42 (mVenus), 0.28 (mScarlet) |
| 1% Tween in 0.1 M MES pH 6.3 | 1 | 1 | 0.5-1 | 1 |
| Beads (4% solids) | 10 | 10 | 10 | 10 |
The samples were checked for aggregation by dynamic light scattering (Prometheus Panta). A small percentage of the beads in each sample were aggregated (not enough to affect the distribution in DLS); these aggregates were visible as bright fluorescent chunks on the bottom of the well and they were avoided during imaging.
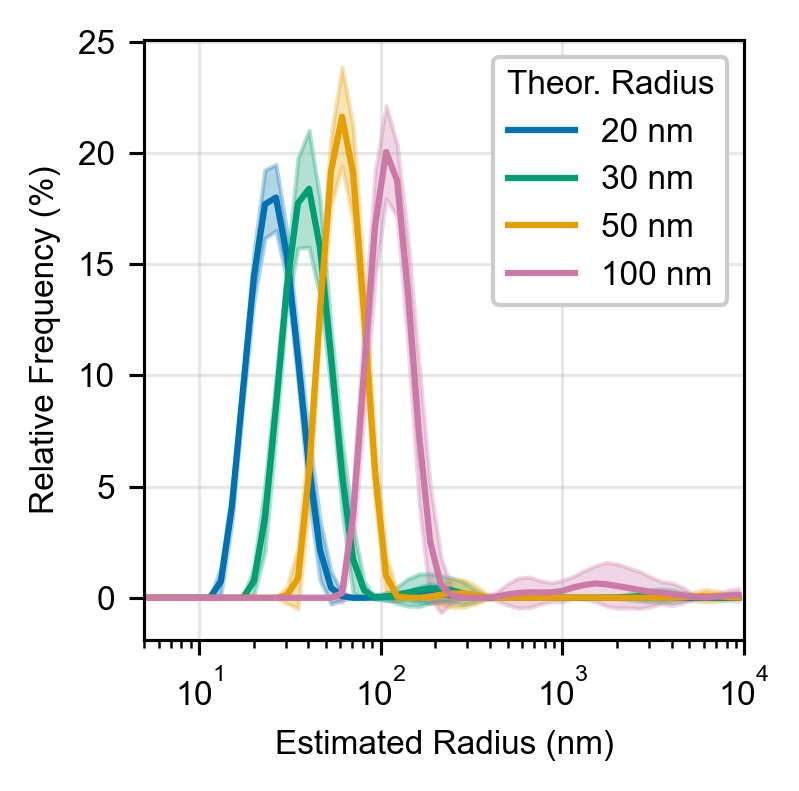
FP-bead mixtures with varying bead diameters were diluted 100x into MilliQ purified water before measurement. Estimated size distributions were generated within the DLS instrument software.
Supplementary Text and Figures
Tumbling versus other approaches to measuring interaction in situ
Given the importance of molecular interactions, it is no surprise that an array of techniques has been developed to investigate them. Many of these approaches operate only out of the molecule's native context and/or destroy the sample (e.g. isothermal titration calorimetry, yeast 2-hybrid assays, crosslinking assays, immunoprecipitation). We focus here only on techniques that allow real-time monitoring of protein-protein interactions in their native context. Three principal approaches exist, namely:
- Förster resonance energy transfer (FRET) is often used to determine if two fluorophores are within 10 nm of each other, suggesting that the proteins they label are binding. However, improper label positioning can lead to false negatives where the fluorophores are >10 nm apart even in the bound complex. Correct implementation of this double labeling typically requires detailed structural information and experimental trial-and-error [Piston 2007]. More fundamentally, since both partners must be labeled, FRET primarily serves to confirm suspected interactions rather than discover new ones.
- Single-particle tracking (SPT) [Ghosh 1994, Hess 2007, Manley 2008] tracks translational diffusion to estimate particle size. Translational diffusion rate is proportional to the cube root of particle volume, whereas rotational diffusion rate is proportional to volume, making SPT dramatically less sensitive to size than tumbling measurements are. Furthermore, because SPT requires resolution of single particles, it imposes stringent requirements on label density and/or requires the use of photoactivatable fluorophores. In addition, SPT is very time- and data-intensive: (1) spatial resolution must be high enough to resolve individual particles, (2) the time course must be long enough to capture diffusion trajectories, and (3) multiple acquisitions are required to build up an interpretable distribution, as each field of view can only include a small number of particles. The tumbling measurements we describe here, by contrast, are bulk techniques, able to record from many fluorophores in one pixel. Overall, we estimate that SPT requires ≈6 orders of magnitude more data and time to reveal size information than tumbling measurements, while imposing more stringent requirements on the sample and hardware.
- Fluorescence correlation spectroscopy (FCS) [Magde 1972] measures translational diffusion time by brightness fluctuations as fluorophores pass through a focal volume, and therefore FCS suffers from many of the downsides of SPT. Although it can tolerate up to a few fluorophores in the focal volume at one time, it produces less information per particle. FCS is implemented on a point scanning instrument, interrogating only one point at a time. Building an image requires raster scanning of the point through the sample, further decreasing speed.
In principle, tumbling measurements outperform these other technologies. Sensitive measurements of size can be made for a labeled protein of interest with acquistions that are only ≈1 order of magnitude slower than a fluorescence intensity image. Historically, the key downside to tumbling measurements was the size limit of approximately 30 kDa, which is eliminated by the recent incorporation of longer-lived states [Volpato 2023, Lu 2023]. We believe it is a particularly fruitful time for development of tumbling-based measurements that take advantage of this expanded size range.
Relationship between tumbling time and particle size
Throughout this work, we refer to particle size, mass, and volume interchangeably and relate them to the tumbling (rotational diffusion) time. This approach is accurate for spheres of uniform density, which we believe is an acceptable model for protein complexes in solution as long as the fluorescent tag can be rigidly attached to the target.
Even when particles cannot be approximated as spheres, particle size still affects the tumbling time; all other things being equal, larger particles tumble more slowly. However, extracting the absolute particle volume or mass becomes more complicated. For example, a very elongated particle may display multiple tumbling times corresponding to rotation about its various axes [Lakowicz 2006]. Even for non-negligible deviations from spherical, this effect is small; for example, the fluorescence anisotropy of a GFP monomer (a cylinder 4.2 nm high with a diameter of 2.4 nm, PDB ID 1GFL) is well-described by a single tumbling time [Swaminathan 1997, Suhling 2002]. Importantly, we only simulate particles in solution. The hindered tumbling of proteins in membranes can reveal information about size, aggregation, and membrane composition [Kinosita 1977], but we do not address it here.
Our simulation code specifies rotational diffusion rates via a tumbling time \(τ\) (called diffusion_time in the API), which is equal to \(\frac{1}{2D}\), where \(D\) is the diffusion constant
[Ghosh 2013].
\(D\) can be estimated for spherical particles from the Stokes-Einstein-Debye relation
[Landau 1987]
, where \(η\) is the viscosity, \(R\) is the radius, and \(k_{b}\) is Boltzmann's constant (equation 1).
To the best of our knowledge, this diffusion coefficient \(D\) is the same one that appears on page 367 of
[Lakowicz 2006].
The original reference is in French
[Perrin 1926],
and Lakowicz does not provide a definition for \(D\). Instead, we ran our simulation code and found that our calculated anisotropy agrees with the predicted anisotropy in that convention. We also note that Lakowicz parameterizes rotational diffusion with a "rotational correlation time" equal to \(\frac{1}{6D}\), which we believe is equal to diffusion_time divided by 3. Additional context around these two different conventions is provided in
[Jameson 2011].
Expected tumbling times in the cell
How long does it take protein complexes to tumble? We can estimate the relevant timescales using the tumbling time of GFP in a cell as a conversion factor (27 kDa ≈ 90 ns, [Swaminathan 1997]). Consider a common cellular event such as transcription factor binding to DNA. We would expect the 154 kDa lac repressor's tumbling time to increase from ≈300 ns to >10 μs when it binds to DNA and becomes immobilized. In another example, consider the assembly of a large protein complex such as the lysosomal V-ATPase. If a small protein component (≈45 kDa) becomes a part of the V1 subunit, we can expect its tumbling time to rise from ≈100 ns to ≈1 μs [Forgac 1998]. Its tumbling time would further increase to >10 μs when the V1 subunit associates with the membrane-bound V0 subunit to form an active pump. At the extreme end of the scale, very large structures, like viral capsids—or beads as in Figure 2—exhibit tumbling times of 10-5-10-3 seconds [Volpato 2023].
Quantifying alignment of a population of particles
Colloquially, alignment assesses how "lined up" a population of molecules is. Formally, for an individual molecule, we define alignment as the square of the cosine of the angle between the external reference (e.g. polarization of the input beam) and the dipole of the molecule. From an absorption standpoint, and for alignment, pointing straight up is the same as pointing straight down. By taking the mean of this value over many particles, we determine the alignment of a population (equation 2). An alignment of 1 indicates all dipoles are parallel to the reference ("perfectly aligned"); an alignment of 0 indicates all dipoles are perpendicular to the reference ("perfectly anti-aligned"). Randomly oriented dipoles have an alignment of \(\frac{1}{3}\). Most optical tumbling measurements involve partially aligned populations, with an alignment between \(\frac{1}{3}\) and 1.
Experimentally, the alignment of the fluorophores' emission dipoles is assessed by collecting the emitted fluorescence in parallel and perpendicularly polarized channels (relative to an external reference). For ease of visual inspection, it is sometimes convenient to condense the two detectors' output to a single quantity that captures the enrichment of parallel over perpendicular signal. Throughout this work, we use the polarization \(P\) (equation 3), where ∥ and ⊥ indicate the signal in those channels.
Intensity versus fluence
We refer to light intensity throughout the text (power per unit area). Because our code simulates infinitely short pulses, it would be more strictly accurate to refer to fluence (energy per unit area), as doubling the pulse duration while halving the energy would not change the result. Nevertheless, intensity and fluence are proportional for a constant pulse duration, and because intensity is a more familiar term, we use it throughout in the interest of communication.
Using these infinitely short pulses, we can simulate illumination of longer duration with a succession of pulses over a time interval. Saturation intensities provided throughout the text are the per-pulse intensities.
Usage examples for the tumbling simulation code
To provide a facile on-ramp for new users, we include a simple demonstration of a tumbling simulation below.
To use the code, you will first need to download fluorophore_rotational_diffusion.py from GitHub and place it in the same directory as your script. Your script should import this module. We also import numpy and matplotlib.
import numpy as np
import matplotlib.pyplot as plt
from numpy.random import uniform
from fluorophore_rotational_diffusion import Fluorophores, FluorophoreStateInfo
The simplest use case is (arguably) a steady-state fluorescence anisotropy measurement, in which a population of fluorophores is excited with linearly polarized light and the integrated emission in parallel and perpendicular channels is recorded. To simulate such an experiment, execute the following code. Note that the illumination intensity is defined in saturation units, where intensity \(x\) will excite a fraction of the available fluorophores equal to \(1-2^{-x}\). Time units aren't specified, so be consistent with whatever time units you use for tumbling time and fluorescence lifetime. For example, you may choose to think of the base time unit as nanoseconds. The times here are approximately correct for GFP in a cell; play with them and see how it affects the polarization! You can also adjust the number of molecules, the intensity of the light, and the excitation polarization.
# Set up the "fluorophores" object and run the simulation
tumbling_time_ns = 90
fluorescence_lifetime_ns = 2
state_info = FluorophoreStateInfo()
state_info.add('ground') # Molecules default to being in the first state you specify
state_info.add('excited', lifetime=fluorescence_lifetime_ns,
               final_states='ground')
a = Fluorophores(number_of_molecules=5e7,
                 diffusion_time=tumbling_time_ns,
                 state_info=state_info)

a.phototransition('ground', 'excited',
                  intensity=0.01, polarization_xyz=(1, 0, 0))
for i in range(10):
    print('.', end='')
    a.delete_fluorophores_in_state('ground')
    a.time_evolve(fluorescence_lifetime_ns)
We now would like to read out the results from this population of fluorophores. All of the state transition events were being tracked during the simulation, so we call get_xyzt_at_transitions to obtain 1D arrays with x, y, z, t coordinates corresponding to each transition. Note that x, y, and z here are components of the orientation vector, not positions; t is time. If we assume each transition results in emission, we can then probabilistically assign that emission photon to a detector channel (X or Y), weighted by the particle's orientation.
# Calculate steady-state anisotropy
x, y, z, t = a.get_xyzt_at_transitions('excited', 'ground')
p_x, p_y = x**2, y**2 # Probabilities of landing in channel x or y
r = uniform(0, 1, size=len(t))
in_channel_x = (r < p_x)
in_channel_y = (p_x <= r) & (r < p_x + p_y)
total_x = sum(in_channel_x)
total_y = sum(in_channel_y)
polarization = (total_x - total_y) / (total_x + total_y)
print('')
print('Total x (parallel) counts:', total_x)
print('Total y (perpendicular) counts:', total_y)
print('Polarization: {:0.2f}'.format(polarization))
# Sample output from this code (your results will vary slightly)
# Total x (parallel) counts: 67139
# Total y (perpendicular) counts: 24167
# Polarization: 0.47
If we want to see when these emission events occurred (i.e. do "time resolved fluorescence anisotropy" instead of "steady-state"), we need to histogram the emissions from the two detectors in time.
# Calculate time-resolved anisotropy
t_x, t_y = t[in_channel_x], t[in_channel_y]
bins = np.linspace(0, 5*fluorescence_lifetime_ns, 200)
bin_centers = (bins[1:] + bins[:-1])/2
(hist_x, _), (hist_y, _) = np.histogram(t_x, bins),  np.histogram(t_y, bins)

print("Saving results in test_classic_anisotropy_decay.png...", end='')
plt.figure()
plt.plot(bin_centers, hist_x, '.-', label=r'$\parallel$ polarization')
plt.plot(bin_centers, hist_y, '.-', label=r'$\perp$ polarization')
plt.title(
    "Simulation of classic time-resolved anisotropy decay\n" +
    r"$\tau_f$=%0.1f, $\tau_d$=%0.1f"%(a.state_info['excited'].lifetime,
                                       a.orientations.diffusion_time))
plt.xlabel("Time (ns)")
plt.ylabel("Photons per time bin")
plt.legend(); plt.grid('on')
plt.savefig("test_classic_anisotropy_decay.png"); plt.close()
print("done.")
# Result will be a file on disk with the graph similar to the graph below.
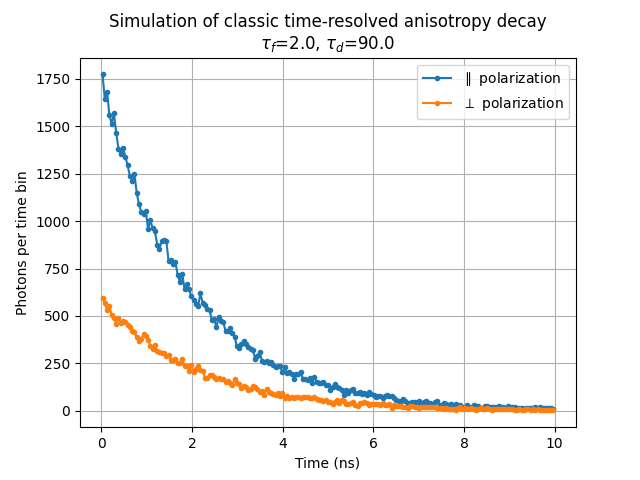
The above example is also available within fluorophore_rotational_diffusion.py in _test_fluorophores_anisotropy_decay_plot(). Further documentation of the fluorophore rotational diffusion API is available in docstrings for each function. The scripts that generate each of the simulation figures are available on GitHub with this manuscript.
Experimental factors that reduce measured polarization
An unaligned but immobile population of fluorophores should fluoresce with a polarization of 0.5 when excited with unsaturated, linearly polarized light. However, this is rarely observed, as many experimental details can reduce the measured polarization [Vogel 2009], namely:
- The data in this paper were collected with a 100x 1.4 NA oil immersion objective lens. The mapping between polarization in the sample and at the back focal plane of a high NA objective is complicated, but the net result is a reduction in the maximum measured polarization [Axelrod 1979]. Indeed, in the time-resolved polarization decays of the prompt singlets (Figure S2), we observe a maximum polarization of ≈0.4.
- Saturation in any of the linearly polarized laser pulses will excite a different distribution of fluorophore orientations. Once the parallel channel is saturating, increased excitation power will disproportionately excite molecules in the perpendicular channel. However, working in a somewhat saturating regime, as we do here, may be advantageous to obtain higher total photon counts.
- Fast depolarization in the sample can occur independent of rotational diffusion. Some possible sources of this include:
- homo-FRET between fluorophores
- free fluorophore that is not conjugated to the target of interest
- independent movement of the fluorophore label with respect to the target ("floppy linkers")
- non-parallel excitation and emission dipoles
Detector requirements for triggered triplets
The process of generating triplets also generates a much larger amount of prompt fluorescence from the pump beam. In the pulse schemes described in Figure 4 and Figure 5, the pump-generated signal does not contain protein-protein interaction information and will dominate the triggered triplet (probe) signal if they are not separated. Because we expect that the prompt singlet and triggered triplet signal are identical in spectrum and lifetime, the most straightforward way to disambiguate the two is in the time domain.
There are a few ways one could implement the detector timing. One approach would be to use a time-resolved detector (e.g. a SPAD), but this is more time resolution than is necessary and would reduce the possible photon count rates dramatically. Another approach would be to use a gated camera, blocking out any photons from the pump pulse and only activating the sensor during the probe pulse. Although this discards the pump-generated photons (which could be used to make a fluorescence intensity image), it has the attractive feature of allowing multiple repetitions of pump and probe within a single camera exposure, which could increase total signal by several orders of magnitude. A double shutter camera allows collection of both the pump- and probe-generated photons, but the sensor would need to be read out after every pump-probe cycle.
Comparison of rsFPs and triggered triplets
Reversibly switchable fluorescent proteins (rsFPs) and triggered triplets have different strengths and weaknesses as tumbling reporters. For rsFPs:
- (+) rsFPs can provide many photons per molecule per switching cycle and can be switched many times, allowing for higher signal levels [Grotjohann 2012].
- (-) rsEGFP2 [Grotjohann 2012], and likely other rsFPs, do not switch immediately, residing in at least one microsecond-scale intermediate dark state [Woodhouse 2020, Volpato 2023]. As a result, their active states are largely unavailable during some of the most relevant tumbling times for cellular proteins.
- (-) The absorption dipole of the photoswitching transition is not parallel to the absorption dipole for fluorescence excitation of the active form of the rsFP. For the rsFP Dronpa, this angular offset is approximately 30 degrees [Yadav 2015], reducing the accessible dynamic range of polarization.
- (-) Many rsFPs remain on for hours after switching unless they are actively switched off, producing accumulating background. Full off-switching requires additional light doses and time, and it is hampered by molecular rotation out of plane.
Triggered triplets, also known as optically activated delayed fluorescence, exhibit a nearly orthogonal set of pros and cons, with distinct advantages in biologically-relevant size scales:
- (+) Triplets are available immediately and are effectively background-free once the fluorescent excited state has fully decayed (>5 fluorescence lifetimes).
- (+) Even if the triplet absorption dipole is rotated with respect to the initial excitation, emission appears to be from the excited singlet [Peng 2021]. Given that, we expect that the relevant dipoles are the singlet absorption and the singlet emission, which are close to parallel in many common fluorophores, allowing for high maximum polarization of the triggered triplet emission. If the triplet absorption dipole aligns with the singlet emission dipole, controlling the polarization of the triggering light boosts polarization dynamic range, e.g. through crescent selection.
- (+) Triplets "clean up after themselves;" they return to the ground state on their own in milliseconds, obviating the need for subsequent illumination to reduce background.
- (+) Triplet triggering back to an emissive singlet state has been observed in commonly used fluorophores, such as GFP, mVenus, mScarlet, and fluorescein (Figure 6 and Demissie 2020, Peng 2021). Labeled protein constructs that were originally designed for fluorescence imaging can in principle be used for tumbling if the linkers are sufficiently rigid.
- (-) The signal from triggered triplets with current fluorophores is very low relative to the number of singlets generated by the initial illumination. Approximately 100 prompt singlet photons are generated for each triggered triplet photon.
- (-) Even with optimized fluorophores, triplet triggering would produce at most one photon per two input photons (triplet generation and trigger).
Triggerable state lifetimes in FPs
Triplet state lifetimes typically range from microseconds to milliseconds, with recent evidence for ≈1 ms triplet lifetimes in certain fluorescent proteins [Peng 2021]. Encapsulation of the chromophore putatively enables these long-lived triplets by protecting them from solvent and dissolved oxygen.
The lifetime of the triggerable fluorescence determines the maximum possible particle size that can be resolved with tumbling. From a technological standpoint, we’d like a very long-lived state that we can trigger to emit whenever is relevant for the size scale we are working with.
We estimated the lifetime of the triplet state by measuring how the total triggered signal (parallel + perpendicular channels) decays over time (Figure S4). To deconvolve the effects of translational diffusion and triplet state decay, we analyzed results from 40, 60, 100, and 200 nm diameter beads. All samples give roughly the same lifetime, suggesting that most of the signal loss is independent of translational diffusion. We find that the half-life of the triplet signal in mScarlet and mVenus is on the order of 1 ms, with mVenus’s lifetime slightly exceeding mScarlet’s. This >1 millisecond time window allowed us to record the tumbling of beads at least 200 nm in diameter (Figure 6), which is roughly the size of a small lysosome. Therefore, FPs as triggered emitters should be able to report on sizes corresponding to most of the proteome.
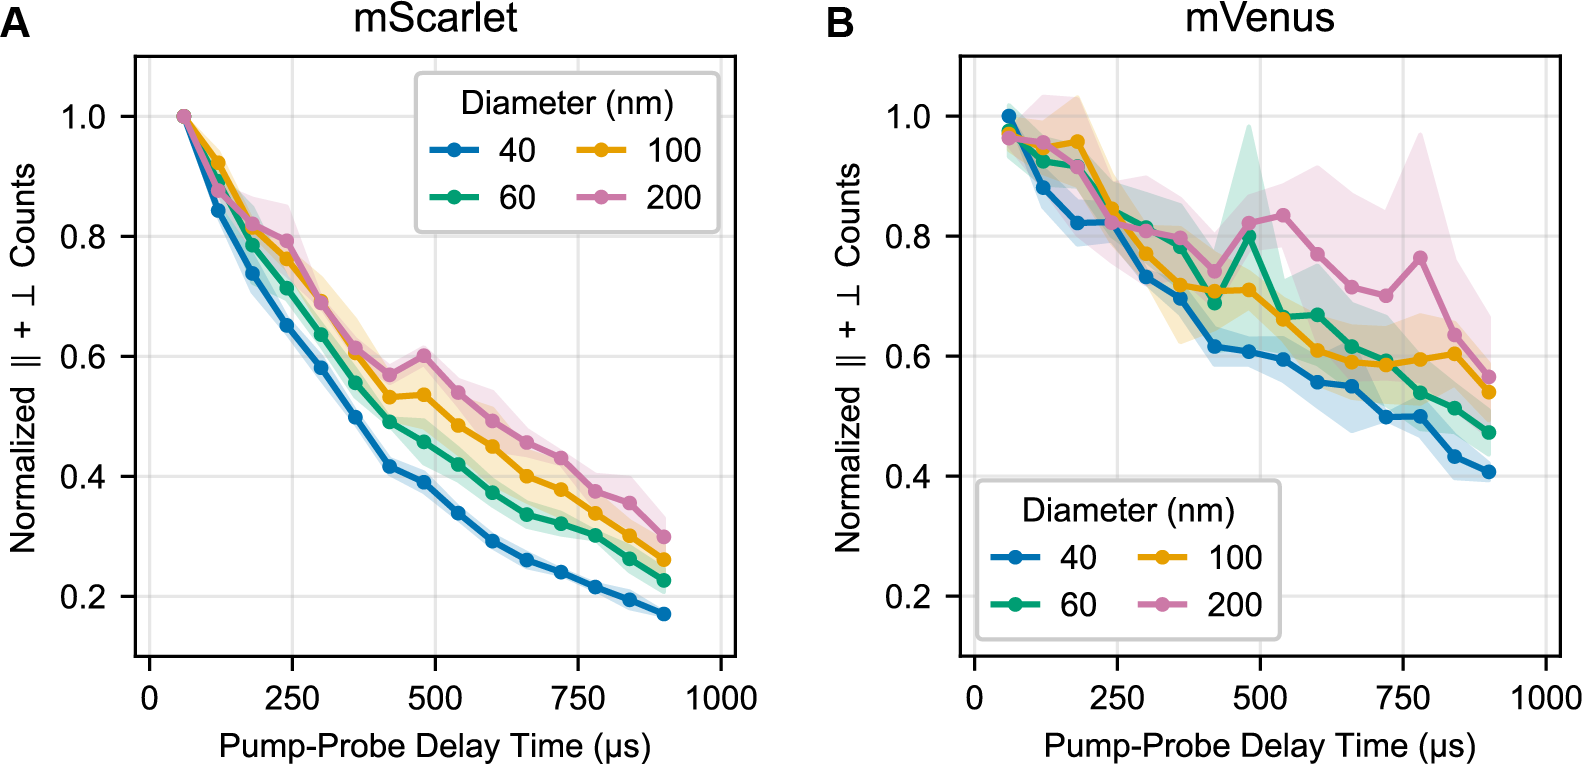
The decay of the normalized total counts summed across both detectors over time was evaluated for (A) mScarlet and (B) mVenus adsorbed to 40, 60, 100, and 200 nm beads. Total counts provide a proxy for the number of triggerable emitters (i.e. still in the putative triplet state) available within the focal volume of the probe laser. These data are from the same experiment as Figure 6C.
Nanosecond-scale dynamics of prompt and triggered FP fluorescence
The lifetime of the triggered emission from triplet states was previously reported to match the fluorescence lifetime of the prompt singlet emission
[Peng 2021].
This observation supports a mechanistic model in which the triggering beam regenerates an excited singlet state, which then emits. To corroborate this, we analyzed the lifetimes of the prompt and triggered signals from mVenus and mScarlet. For protein in solution, we observed good agreement between the prompt and triggered lifetimes (Figure S5 and Figure S6 with condition PBS pH 7 or 0.1 M MES pH 6.3 selected).
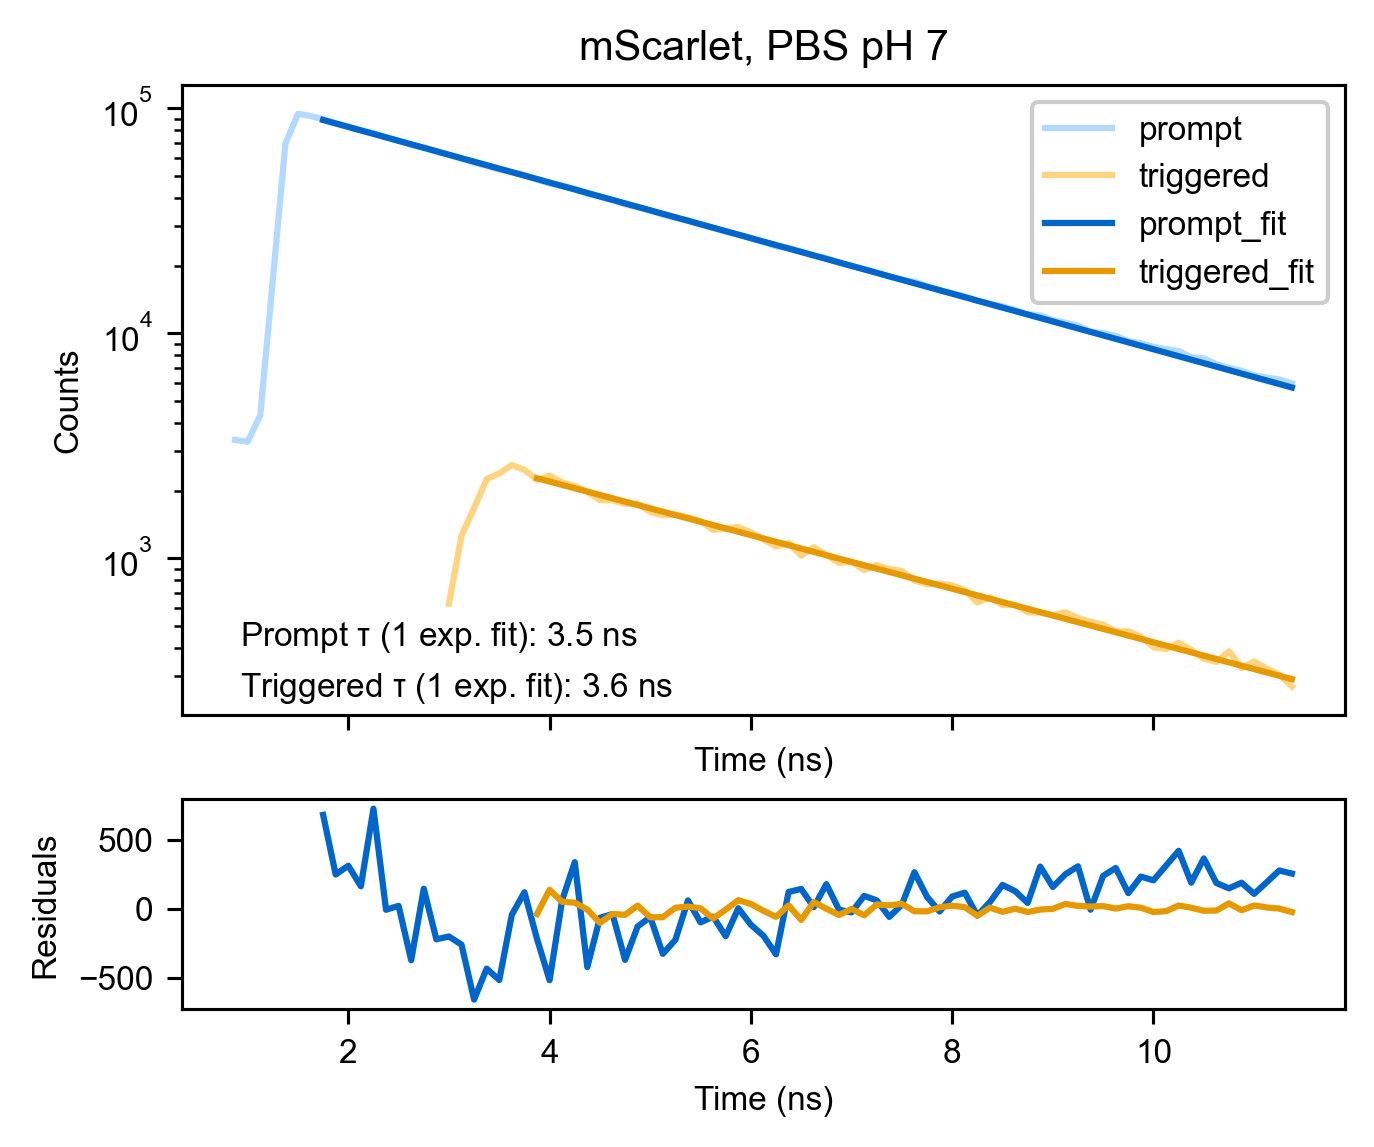
Curiously, when we compared the prompt and triggered lifetimes for protein adsorbed to beads, we found a shortening of the prompt lifetime, whereas the triggered lifetime was less affected (Figure S5, Figure S6 with condition 40 nm beads). Furthermore, the triggered lifetime was well-described by a single exponential fit, whereas the prompt fluorescence lifetime required a sum of at least two exponential components to describe it. The acidity of both the buffer for bead adsorption (0.1 M MES pH 6.3) and the carboxylate surface of the beads likely adds some biexponential character and decreases the lifetime of these FPs from their reported values of 3.9 and 2.7 ns for mScarlet and mVenus respectively
[Bindels 2017,
Kremers 2006].
However, decreasing the pH further with the protein in solution did not fully recapitulate this difference between the prompt and triggered lifetimes (Figure S5, Figure S6 with condition Carmody IB pH 5).
We don't understand why adsorbing these FPs to beads seems to shorten their prompt lifetime but not their triggered triplet lifetime, but we suspect there may be some interesting mechanistic insights about triplet triggering contained here. Zooming out from the nuances of this experiment, a nanosecond-lived emission is far more consistent with emission from a singlet state (i.e. fluorescence) than emission from a triplet state (i.e. phosphorescence), supporting a model in which the trigger beam returns the fluorophores to a singlet state.
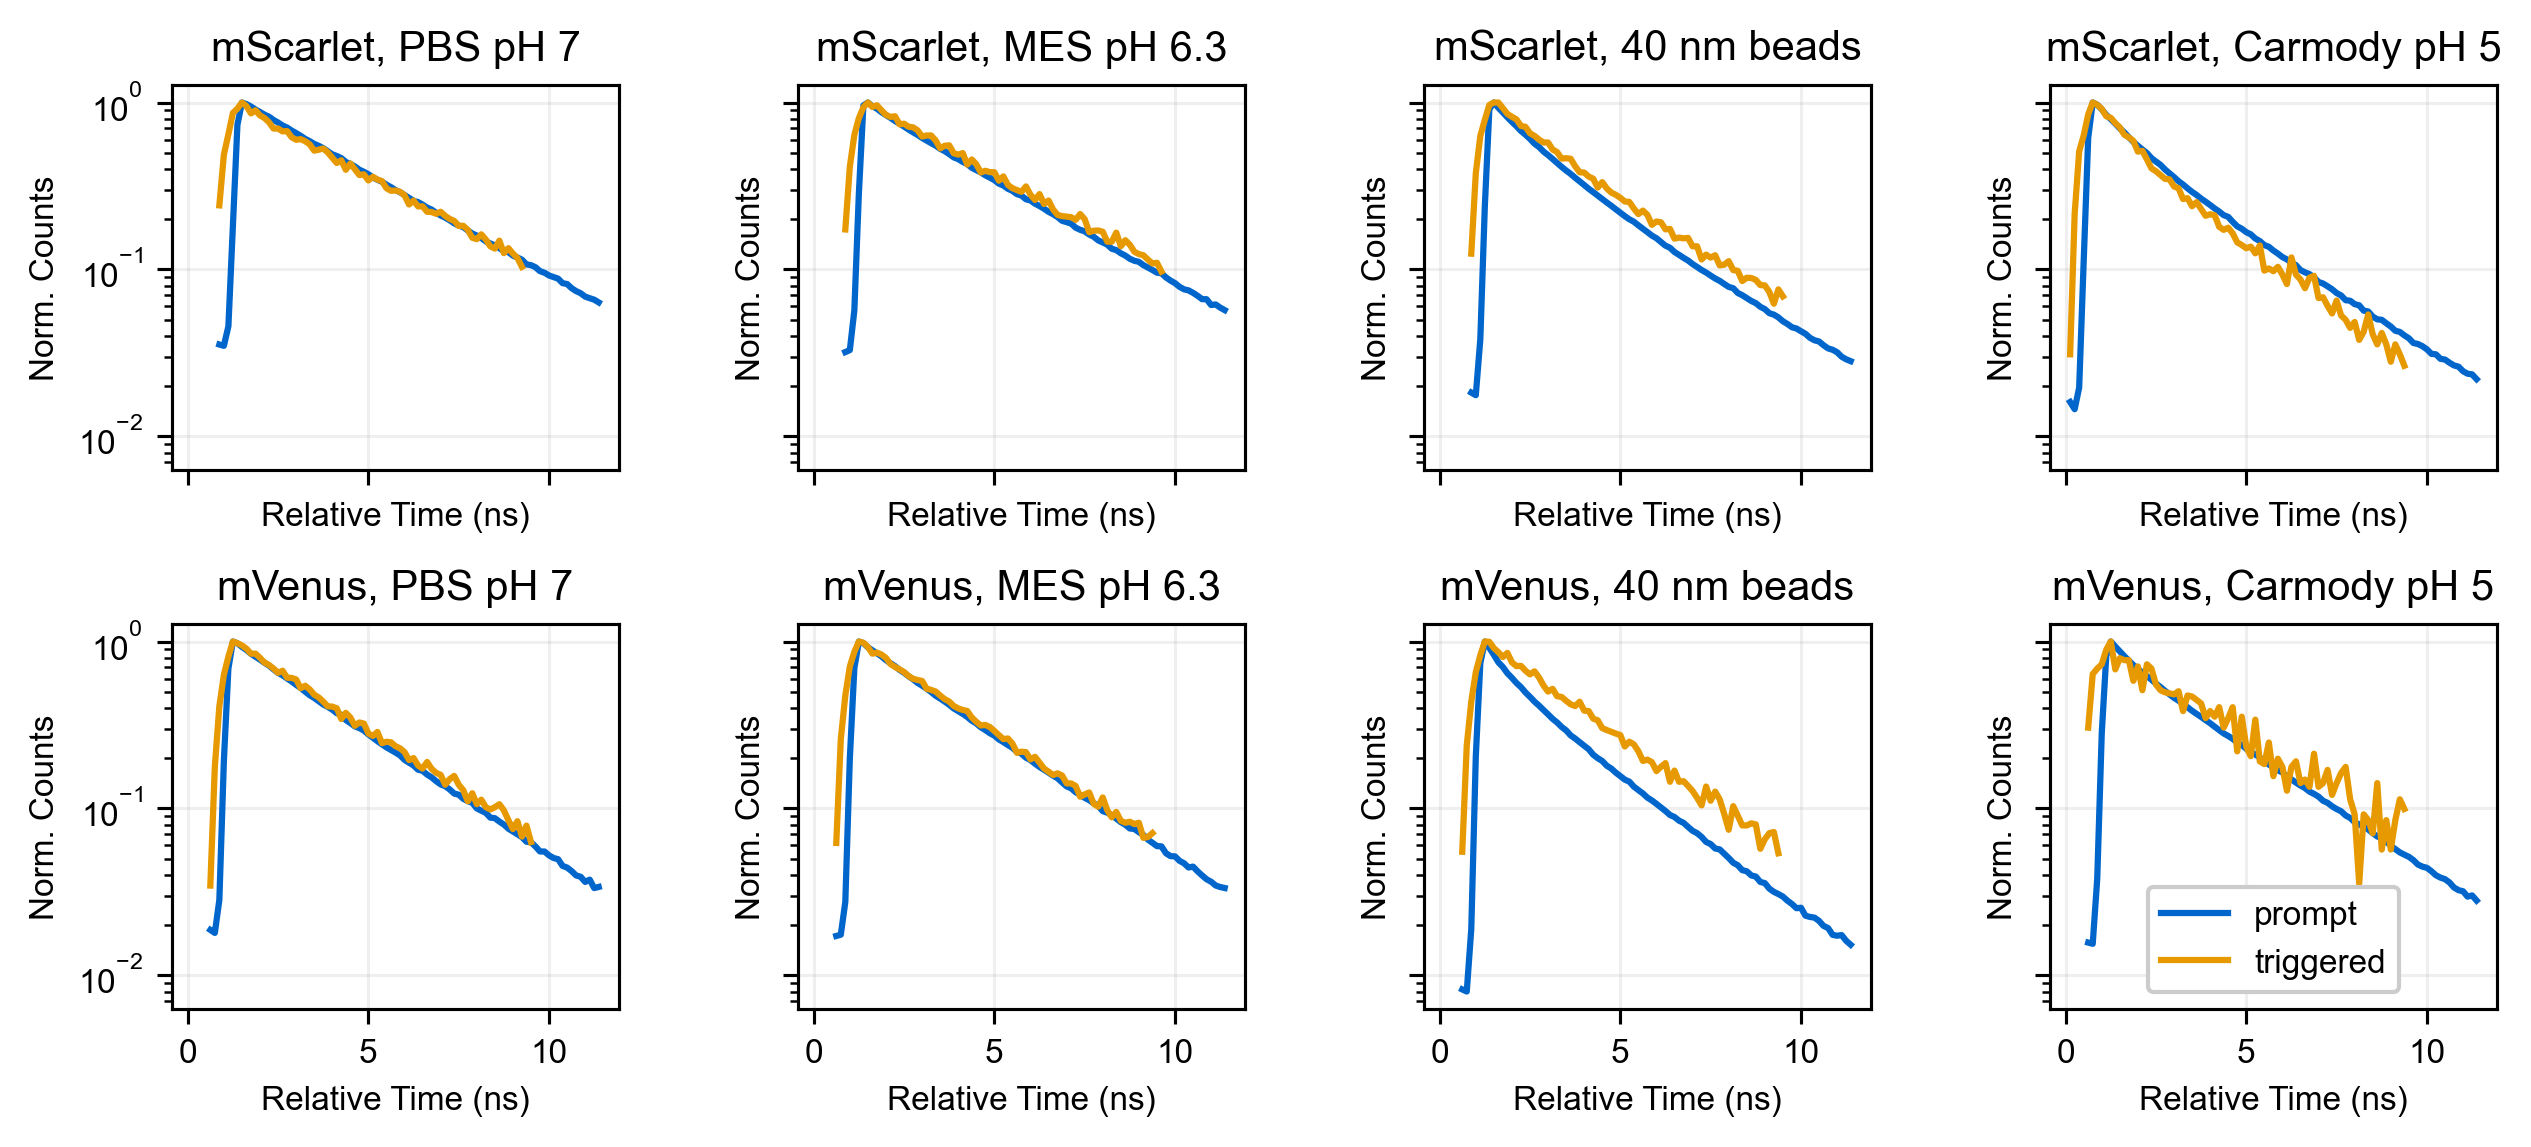
The trigger beam was fired 2 ns after the pump beam in this experiment, but we shifted the triggered decay to overlay with the prompt decay for ease of visual inspection. Each decay is normalized to its peak. Power used for the triplet triggering were similar to those used in Figure 6, and power used for the singlet measurements was similar to those used in Figure S2. Fluorescence was collected on the internal detectors (HyDs) without an emission polarizer. Protein in solution measurements contained ≈5-10 μM FP. "Carmody IB" refers to an imaging buffer with the following composition in mM: 140 KCl, 1 CaCl2, 1 MgCl2, 5 glucose, as well as 10% Carmody’s buffer (phosphate-citrate-borate universal buffer [Carmody 1961]).
| Fluorescent protein: | Condition: |
These data are replotted from Figure S5. Singlet fluorescence and prompt triplet decays were made with different laser powers to keep the relevant signal within the acceptable range of the SPADs, so relative intensities of the signals should not be compared. Power used for the triplet triggering were similar to those used in Figure 6, and power used for the singlet measurements was similar to those used in Figure S2. Fluorescence was collected on the internal detectors (HyDs) without an emission polarizer. Protein in solution measurements contained ≈5-10 μM FP. Fits shown are tail fits to a one or two exponential model as indicated. "Carmody IB" refers to an imaging buffer with the following composition in mM: 140 KCl, 1 CaCl2, 1 MgCl2, 5 glucose, as well as 10% Carmody’s buffer (phosphate-citrate-borate universal buffer [Carmody 1961]).
Increasing alignment with ‘crescent’ selection
If we can increase the alignment of the initial distribution of photoselected molecules, we can increase the dynamic range of polarization change observed. Some of the authors here previously patented this approach [York 2019], in which an orthogonally polarized STED beam immediately follows a linearly polarized pump beam to deplete off-angle molecules. We refer to this second beam carving the population as ‘crescent’ selection.
We predicted that a saturating triplet-triggering beam immediately after the initial pump could be used to similarly narrow the angular distribution and increase the dynamic range. We simulated the effects of such a beam on the measured polarization of an ideal triggered emitter (Figure S7). This simulation predicts that a saturating crescent beam can indeed increase the total change in polarization observed during tumbling.
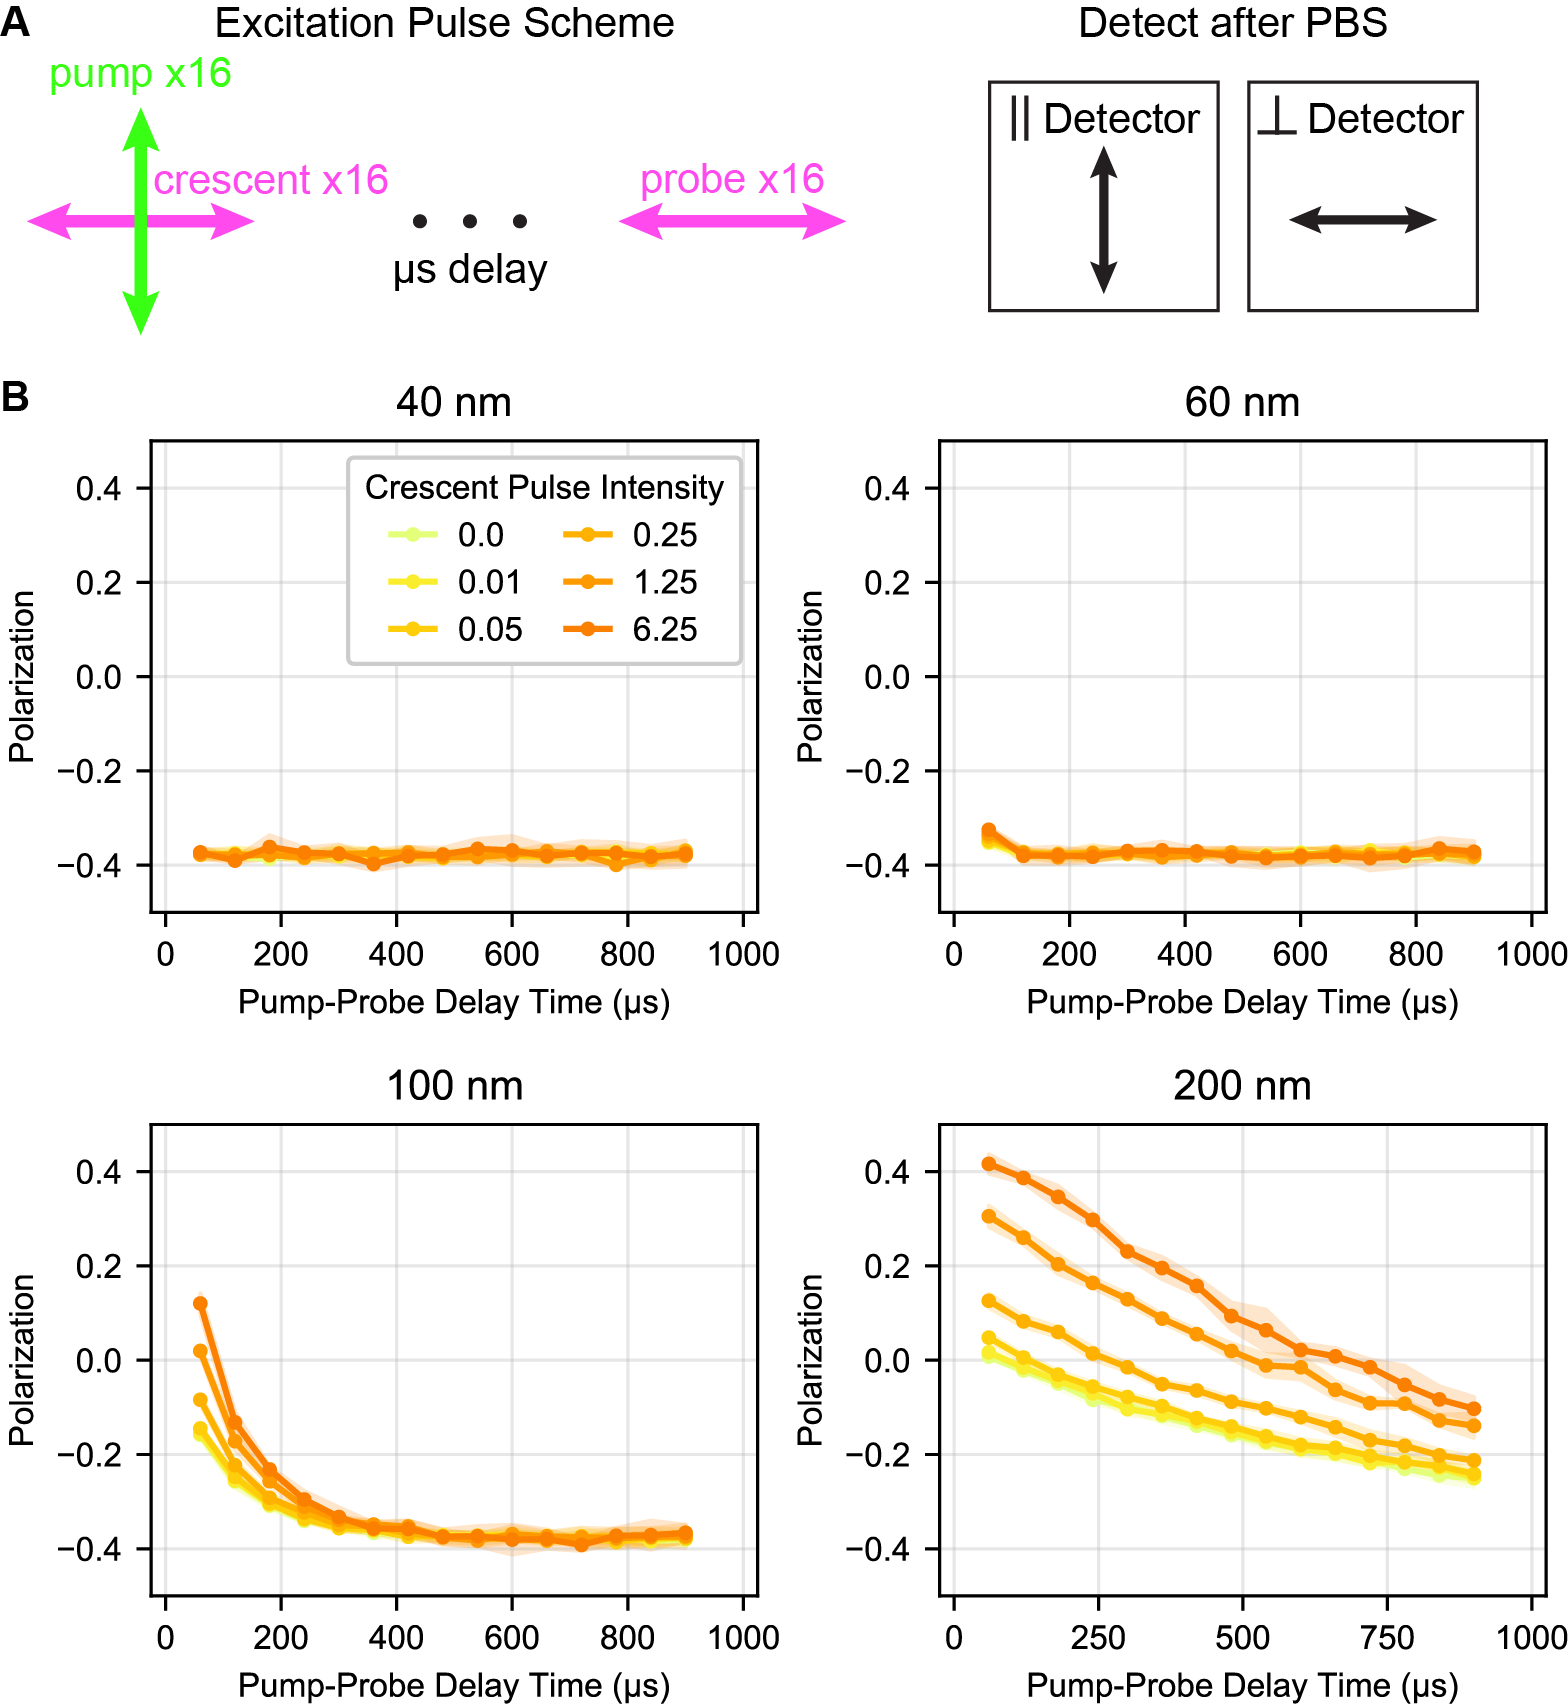
The polarization of the triggered emission was recorded at different intensities of crescent power. Each simulation included 106 molecules, a pump (16 pulses of intensity 2), and a probe (16 pulses of intensity 0.25) illumination, matching the 200 ns dwell time and 80 MHz repetition rate of the experimentally available laser.
We then investigated how well crescent selection of mScarlet or mVenus experimentally matches these simulations (Figure S8). With the inclusion of crescent selection, we observe a very small (perhaps negligible) increase in the dynamic range that increases with the power of the crescent beam and is accompanied by a loss in triplet signal. Experimentally, we observe less gain from the crescent selection than the simulation predicts.
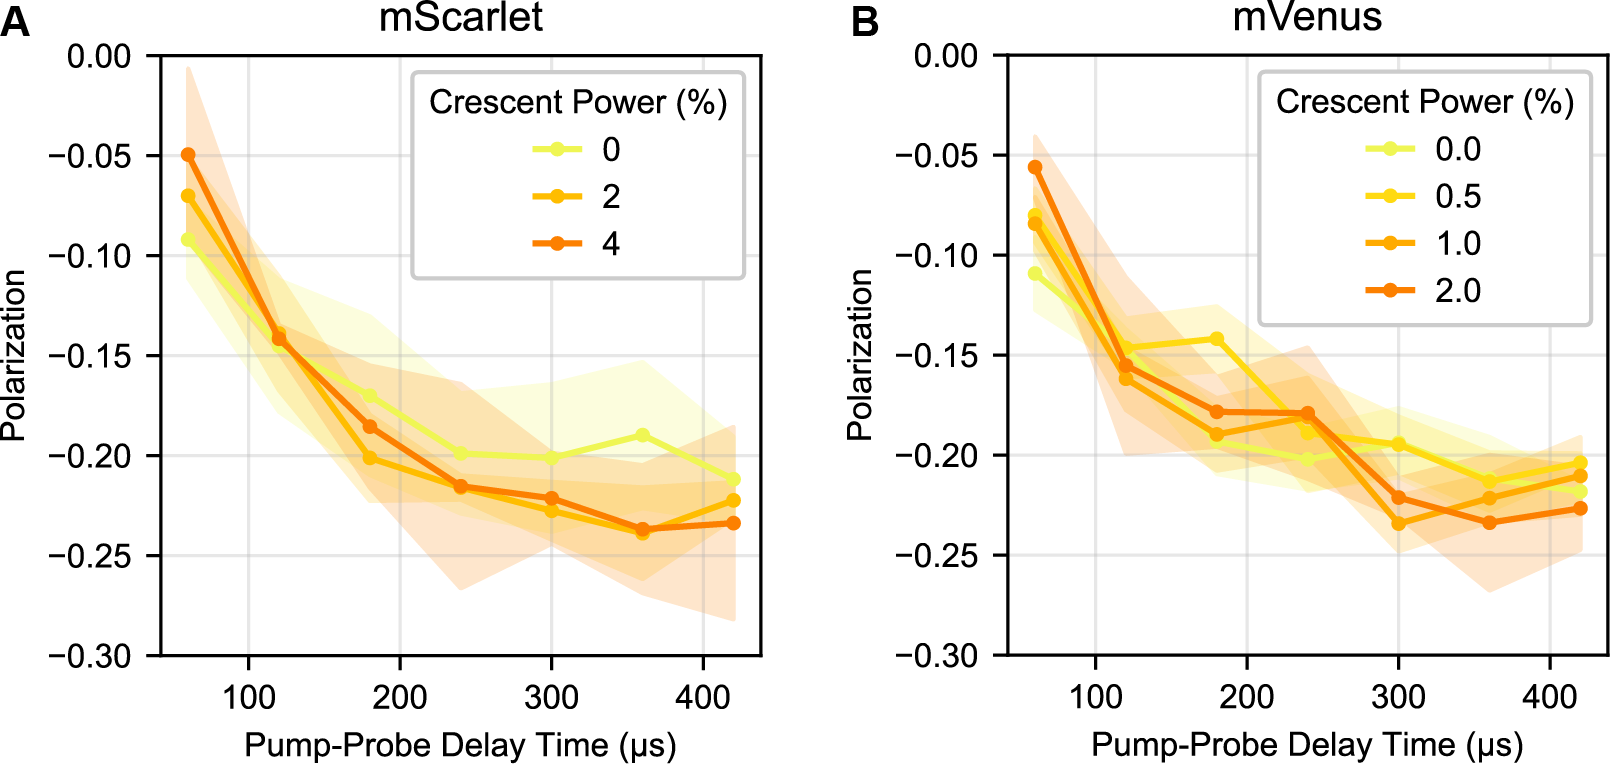
Tumbling of 100 nm beads labeled with (A) mScarlet or (B) mVenus was examined with varying powers of ‘crescent’ selection, using the pulse scheme in Figure S1. Because the crescent beam here was fired 2 ns after the pump beam, excited singlets were still present and some contribution from STED is possible, especially in mScarlet. For mVenus, the spectral separation is such that the 775 nm triggering beam should primarily interact with the triplet state rather than the excited singlet state. Laser powers are provided in percent of the total power in the microscope software. 0.5% power is approximately 100 μW and 2% power is approximately 400 μW average power at the sample.
A trivial explanation for this discrepancy between simulation and experiment would be that we are not saturating the triplet triggering enough to change the distribution of triplet orientations. To evaluate this, we need to calibrate our experimental intensity with respect to the saturation units used in the simulation. We estimate saturation of the crescent beam based on the loss of triggered triplet counts when the crescent beam is introduced (Figure S9). In mVenus, 0.5% nominal laser power (≈100 μW average power at the sample) in the crescent beam and a simulated intensity of 2 saturation units both produce a ≈30% loss in the total counts. In mScarlet, 2% nominal power (≈400 μW) crescent selection and a simulated intensity of 4 both produce an ≈50% loss in total counts. We selected these two conditions for side-by-side comparison here and in Figure 6. Based on this loss in signal, we believe that we are using a sufficiently powerful crescent beam that we would expect to see some enhancement of polarization dynamic range.

(A) Simulation of total counts (parallel + perpendicular channels) at 360 μs using a ‘crescent’ selection pulse scheme as described in Figure S1. (B) Experimental results for 100 nm beads coated with mScarlet and interrogated with a crescent pulse scheme. (C) Experimental results for 100 nm beads coated with mVenus and interrogated with a crescent pulse scheme. Units of laser power in (B) and (C) are nominal power in the instrument software (2% ≈ 400 μW average power at the sample).
Our current best guess is that the relative orientation of the singlet and triplet absorption dipoles is responsible for this discrepancy between the simulated and experimental crescent selection. Our simulation assumes that the singlet and triplet absorption dipoles are parallel. If this assumption is violated by mVenus and mScarlet, using a crescent beam to confine the triplet population will not effectively confine the orientations of the singlet dipoles that are regenerated upon triggering. Therefore, we suspect that the singlet and triplet absorption dipoles of mVenus and mScarlet are not parallel; further investigation into their relative orientation would aid in interpretation of our results.
Sequences of Fluorescent Proteins Used
6xHis-mScarlet Protein Sequence
MRGSHHHHHHGMASMVSKGEAVIKEFMRFKVHMEGSMNGHEFEIEGEGEGRPYEGTQTAKL KVTKGGPLPFSWDILSPQFMYGSRAFTKHPADIPDYYKQSFPEGFKWERVMNFEDGGAVTVTQD TSLEDGTLIYKVKLRGTNFPPDGPVMQKKTMGWEASTERLYPEDGVLKGDIKMALRLKDGGRYL ADFKTTYKAKKPVQMPGAYNVDRKLDITSHNEDYTVVEQYERSEGRHSTGGMDELYK*
6xHis-mVenus (also known as Venus A206K) Protein Sequence
MRGSHHHHHHGMASMVSKGEELFTGVVPILVELDGDVNGHKFSVSGEGEGDATYGKLTLKLI CTTGKLPVPWPTLVTTLGYGLQCFARYPDHMKQHDFFKSAMPEGYVQERTIFFKDDGNYKTRAEV KFEGDTLVNRIELKGIDFKEDGNILGHKLEYNYNSHNVYITADKQKNGIKANFKIRHNIEDGGVQ LADHYQQNTPIGDGPVLLPDNHYLSYQSKLSKDPNEKRDHMVLLEFVTAAGITLGMDELYK*
6xHis-mEGFP (also known as EGFP A206K) Protein Sequence
MRGSHHHHHHGMASMVSKGEELFTGVVPILVELDGDVNGHKFSVSGEGEGDATYGKLTLKFI CTTGKLPVPWPTLVTTLTYGVQCFSRYPDHMKQHDFFKSAMPEGYVQERTIFFKDDGNYKTRAEV KFEGDTLVNRIELKGIDFKEDGNILGHKLEYNYNSHNVYIMADKQKNGIKVNFKIRHNIEDGSVQ LADHYQQNTPIGDGPVLLPDNHYLSTQSKLSKDPNEKRDHMVLLEFVTAAGITLGMDELYK*
pRSET_6xHis-mScarlet plasmid for E. coli expression: SnapGene file and GenBank file
pRSET_6xHis-mVenus plasmid for E. coli expression: SnapGene file and GenBank file
pRSET_6xHis-mEGFP plasmid for E. coli expression: SnapGene file and GenBank file